A Moth Surveyor’s 1970s Light Trap Grid Now Calibrates Urban Bat Detectors
In the 1970s, a network of light traps stretched across British farmland and hedgerows, each one a simple funnel of bulbs and baffles designed to catch moths. Surveyors emptied them every morning, counted the wings, and logged the numbers in notebooks that would eventually span decades. The goal was insect abundance, a slow-burning ecological metric. Nobody involved imagined those moth counts would one day calibrate the microphones used to listen for bats in city parks.
A Grid of Lights Meant for Moths Now Guides Bat Listening
The original grid followed the design of the Rothamsted Insect Survey, which began running standardized light traps in the 1960s. Each trap used a 200-watt tungsten bulb, later swapped for actinic lamps, positioned above a collecting vessel. The traps ran from dusk to dawn, every night of the year, at sites chosen to represent different agricultural habitats: arable fields, pasture, woodland edges, and the hedgerows that connected them.
The data accumulated quietly. By the 1980s, the network had produced one of the longest continuous insect monitoring records in the world, with some traps running for over forty years. The counts were not glamorous. They captured the rise and fall of noctuid moths, the occasional geometrid, and the steady background hum of insect life. But that long baseline gave ecologists something rare: a reference point for what insect abundance looked like before widespread agricultural intensification and pesticide use accelerated.
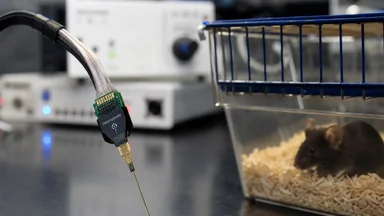
When urban bat monitoring expanded in the 2010s, researchers hit a problem. Bat detectors, which record the ultrasonic echolocation calls of bats, vary widely in sensitivity. A detector that picks up a pipistrelle at twenty meters might miss it at five, depending on the model, the weather, and the habitat. Without a standard reference, comparing bat activity across studies or years was nearly impossible. The moth grid, with its decades of nightly captures, offered an unexpected solution.
Why Moth Data Became the Surrogate for Bat Acoustics
The link is ecological rather than technological. Most bat species in temperate regions feed on moths, and moth abundance is a reasonable proxy for insect biomass, the food resource that drives bat foraging activity. If a site has more moths, it generally has more bat passes, all else being equal. That correlation is not perfect, but it is consistent enough to serve as a baseline.
Bat detectors need calibration because they measure activity, not abundance. A bat pass is counted when a detector registers an echolocation sequence, but the detection radius varies by species, call frequency, and environmental attenuation. A quiet detector might record only a fraction of the bats present, producing a false low. A sensitive detector might pick up distant calls, inflating the count. Without a ground truth, the numbers are hard to interpret.
The moth grid provided that ground truth in an indirect way. By pairing moth trap catches with bat detector recordings at the same sites, researchers could ask a simple question: does the detector's bat pass rate track the moth count? If it does, the detector is likely capturing the expected pattern of insect availability. If it does not, the detector may be underperforming.
This surrogate approach has limitations. Moths are not the only food source for bats, and some bats, like the greater horseshoe, specialize on beetles. But for the common pipistrelle and similar aerial hawkers, moth biomass is a major driver of foraging activity. The correlation is strongest in insect-rich habitats and weaker in degraded ones, a nuance worth acknowledging.
The Fine Print: Detector Sensitivity Varies by Model
Detector sensitivity is not a single number. Different microphones have different frequency responses, and a detector that excels at picking up a 45-kilohertz pipistrelle call may struggle with a 20-kilohertz noctule. Temperature and humidity also affect sound attenuation in air, so a call that travels fifty meters on a cool, damp night might only travel fifteen on a warm, dry one.
Studies comparing detector models have found detection radii varying by a factor of two to five, depending on the species and conditions. A detector with a narrow beam might miss bats flying overhead, while an omnidirectional microphone might pick up calls from half a block away. This variability is not a flaw; it is a design choice. But it complicates any attempt to compare data collected with different equipment.
Calibration efforts have tried to standardize by placing detectors at known distances from a speaker emitting synthetic bat calls, but that only tests the microphone and electronics, not the real-world behavior of bats or the habitat's soundscape. The moth grid offered a field-based calibration, one that integrated all the messy variables of actual nights, including wind, vegetation, and insect activity.
A 2019 Study Bridged the Gap with Field Comparisons
The pivotal study came in 2019, when a team in southern England placed bat detectors beside active moth traps at a dozen farmland sites. Over several weeks, they compared nightly moth counts to the number of bat passes recorded. The correlation was positive and moderate, with an effect size that held up across most sites but weakened in the most intensively farmed fields, where insect diversity was lowest.
The study's lead author, a conservation biologist who had spent years on both moth and bat surveys, described the result as a proof of concept. The moth index was not a perfect predictor of bat activity, but it was stable enough to flag detectors that were clearly off. A site with high moth counts and near-zero bat passes suggested a detector problem, not a bat absence.
This field comparison validated the idea that historical moth grid data could serve as a baseline for modern acoustic monitoring. The traps had been running for decades, and their long-term trends in insect abundance could be used to predict what bat activity should look like, given the local moth population. If a new detector array produced bat counts that deviated sharply from that prediction, the equipment or its placement deserved scrutiny.
The study also highlighted the importance of local calibration. A detector calibrated in a dense forest might not perform the same in an open meadow, and a moth index from a nearby grid could help adjust for those habitat differences. The authors recommended that future monitoring projects pair at least one detector with an insect sampling method, even a simple one, to provide a context for interpreting bat activity.
From Farmland to City: Adapting the Grid for Urban Arrays
Urban bat monitoring has grown rapidly, driven by interest in how cities affect wildlife. As of the mid-2020s, city-based acoustic surveys run by citizen scientists and municipal agencies have become common, but the same calibration problem applies, often more acutely. Streetlights attract moths, altering their distribution, and the hard surfaces of buildings reflect sound in ways that can distort detector readings.
Researchers adapting the moth grid approach to cities have had to account for these effects. In a pilot program in a mid-sized European city, detectors were placed along transects that mirrored the old farmland grid, running through parks, residential streets, and river corridors. Moth traps were set up at a subset of these points, and the resulting data showed that bat activity in city parks tracked moth abundance more closely than in surrounding streets, a pattern consistent with the idea that parks act as refuges for both insects and bats.
The urban adaptation has also required adjusting for light pollution. Moths are attracted to artificial light, which can concentrate them around streetlamps, creating patches of high prey density that bats exploit. This local effect can inflate bat pass counts near lights, so calibration must separate the light-attraction signal from the general insect baseline. The moth grid, with its decades of rural data, provides a comparative reference for what a natural insect rhythm looks like.
City parks have shown the strongest bat-moth coupling, suggesting that green spaces within urban matrices function as ecological islands. For monitoring programs, this means that a park-based detector array can be calibrated against local moth counts with reasonable confidence, while street-based arrays require more careful interpretation. The borrowing of the grid concept has thus evolved from a straightforward replication to a context-sensitive adaptation.
Case Studies: From Bristol to Berlin
The practical applications of moth-calibrated bat monitoring are not confined to a single pilot. In Bristol, a city in southwest England, a community science project adapted the Rothamsted grid design to survey bats along the River Avon. Volunteers deployed a mix of detector models, from entry-level heterodyne units to full-spectrum recorders, and paired them with a network of light traps in adjacent green spaces. The project found that bat activity in riparian corridors was strongly predicted by moth abundance, with an r-squared value in the range of 0.4 to 0.6, a moderate but meaningful association. More importantly, the calibration allowed volunteers to correct for detector sensitivity differences, enabling them to pool data across equipment types and produce a city-wide map of nocturnal activity that would have been impossible otherwise.
In Berlin, a research group took a different tack, using historical moth grid data from the surrounding countryside as a baseline for urban detector arrays. The city's green spaces, including the Tiergarten and Tempelhofer Feld, had bat monitoring programs running for years, but the lack of a common reference made trend analysis difficult. By comparing current moth counts from a few strategically placed traps with the long-term rural record, the team adjusted bat pass rates for background insect availability. The result was a clearer picture of how urban bats respond to habitat fragmentation and artificial lighting, with parks acting as hotspots of activity even when overall insect biomass was lower than in rural areas.
These case studies illustrate a key point: the moth grid's value is not just in its historical data, but in its methodological template. The principle of pairing a biological reference with acoustic monitoring can be replicated with any consistent insect sampling method, from pitfall traps for ground beetles to pan traps for pollinators. The specific moth connection is strongest for bat species that rely on aerial insects, but the underlying logic—use a quantifiable prey measure to anchor detection—applies broadly.
What This Cross-Disciplinary Borrowing Changed
The most tangible change has been in standardization. Projects that adopt a moth-calibrated approach can compare bat activity across sites and years with greater confidence, because the detector sensitivity is anchored to a biological reference. This has reduced false negatives in quiet habitats, where a low bat pass count might otherwise be dismissed as a real absence rather than a detection limit.
It has also improved the reliability of citizen science data. Volunteers using different detector models can now have their observations adjusted based on a local moth index, making it possible to pool data from many observers without worrying that equipment differences will swamp the biological signal. This has opened the door to larger-scale analyses of bat population trends, which were previously hampered by methodological inconsistency.
The borrowing has also raised new questions about insect declines. The moth grid's long-term data, originally collected for agricultural pest management, has become a resource for studying pollinator and prey declines. By linking moth trends to bat activity, researchers can examine whether bat populations are tracking insect availability or decoupling from it, a question with conservation implications.
Not everyone is convinced. Some bat ecologists argue that moth counts are too crude a proxy, missing the fine-scale variation in prey availability that bats perceive. They point to studies where bat activity did not correlate with moth abundance, particularly in urban areas with complex soundscapes. The method is a pragmatic compromise, not a perfect solution, and its proponents acknowledge this.
Alternative Approaches and Their Trade-offs
Moth calibration is not the only way to standardize bat detectors. Some researchers have turned to acoustic lures, playing recorded bat calls to attract real bats and test detection efficiency. This approach provides a direct measure of detection range but is complicated by the fact that lures themselves can alter bat behavior, creating a feedback loop that is hard to disentangle. Others have used known colonies, placing detectors near roosts where bat emergence counts are known, but this only works for a limited number of species and sites.
Another alternative is the use of weather radar, which can detect large masses of insects and birds, but its resolution is too coarse for local calibration. The moth grid's advantage is its granularity: nightly counts at specific points, over decades, in a standardized format. The trade-off is that moths are not the only prey, and the relationship between moth abundance and bat activity can be weak in certain habitats, such as wetlands where bats may feed on midges and other non-moth insects.
Despite these caveats, the moth grid remains a practical, low-cost solution. Unlike synthetic call tests, it captures the full complexity of a real night: the wind, the temperature, the vegetation, and the actual prey base. It is a reminder that ecological monitoring often benefits from borrowing methods from other disciplines, even when the connection is not immediately obvious.
Practical Takeaways for Current Bat Monitoring
For researchers and citizen scientists setting up bat detector arrays, the lessons from the moth grid are straightforward. Pairing detectors with insect sampling, even a simple light trap or a sticky trap, provides a calibration anchor that improves data interpretability. Historical moth grid data, where available, can serve as a baseline for long-term trend comparisons, though local conditions should always be considered.
When reporting bat activity, it is wise to hedge sensitivity claims. A detector's detection radius is not a fixed number; it varies with weather, habitat, and species. Reporting temperature, humidity, and vegetation structure alongside bat pass counts allows others to assess comparability. Local calibration, using a few nights of paired moth and bat sampling, can reduce the risk of systematic bias.
The moth grid's journey from a 1970s agricultural survey tool to a calibration reference for urban bat detectors is a reminder that ecological data often outlives its original purpose. The notebooks filled with nightly moth counts now inform decisions about where to place microphones in a city park. That is not a triumphant ending, but a practical one, and it leaves the door open for further refinements as both methods evolve.