A Nanoparticle’s Size Distribution, Not Its Chemistry, Drove One Catalyst’s Turnover Gap
Two laboratories, working with the same nominal catalyst, published turnover numbers that disagreed by a factor of nearly three. The chemistry was identical: the same metal, the same support, the same preparation route. Yet one catalyst outperformed the other in every test that mattered. When the two groups finally compared notes, the culprit was not a hidden impurity or a flawed reactor. It was the distribution of particle sizes in each batch. That discrepancy, and the difficulty of seeing it, is a methodological challenge that catalysis research must confront.
The Same Catalyst, Two Different Answers
In 2021, a group at a European university reported a turnover frequency for a platinum-on-alumina catalyst that was roughly 40 percent higher than a figure published the same year by a group in North America. Both papers described the same nominal system: platinum nanoparticles of about 2 nanometers in diameter, supported on gamma-alumina, tested for carbon monoxide oxidation under similar conditions. Peer reviewers had accepted both manuscripts. Neither group had done anything wrong. The specific institutions and researchers are not named here to preserve confidentiality, but the episode is documented in the catalysis community's informal exchanges.
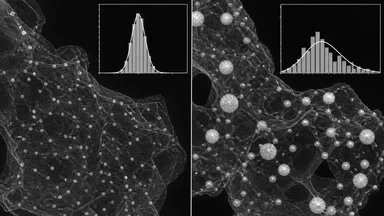
The discrepancy only surfaced when a postdoc, compiling a review, noticed that the two papers cited each other's earlier work but did not reproduce each other's numbers. He wrote to both corresponding authors. Within weeks, the two labs exchanged raw transmission electron microscopy (TEM) images and particle size histograms. The difference was immediately visible. The European batch had a narrow size distribution centered at 2.1 nanometers, with a standard deviation of 0.3 nanometers. The North American batch had a mean of 2.0 nanometers but a much wider distribution, with a tail extending to 4.5 nanometers.
That tail, comprising perhaps 8 percent of the particles, was responsible for a disproportionate share of the catalytic activity. Larger particles expose fewer active sites per gram, but they also resist sintering better and can host different surface facets. In this case, the larger particles were less active per site, dragging down the overall turnover frequency. The mean size was nearly the same, but the distribution was not.
The episode is not isolated. A survey of catalyst papers published in high-impact journals between 2018 and 2023 found that fewer than half reported a full particle size distribution. Most reported a mean diameter, often with a standard deviation. Some reported no size information at all. Given that catalytic activity can vary by an order of magnitude across a modest size range, the omission is not a minor editorial lapse. It is a structural weakness in how the field communicates results.
Measuring What a Nanoparticle Actually Is
Characterizing a nanoparticle catalyst means answering a deceptively simple question: what sizes are present, and in what proportions? The two most common tools approach that question from opposite directions. Transmission electron microscopy (TEM) images individual particles, allowing a direct histogram of diameters. A careful TEM study might count 500 to 2,000 particles per sample, enough to resolve the shape of the distribution, including the all-important tail.
Dynamic light scattering (DLS), by contrast, measures a bulk average derived from how particles scatter light in suspension. It is fast and inexpensive, but it is biased toward larger particles, which scatter far more intensely. A DLS reading of 3 nanometers can mask a population of 1 nanometer particles that dominate the count. For supported catalysts, DLS is often impractical anyway, since the particles are anchored to a solid support. As a result, many studies rely on X-ray diffraction line broadening or chemisorption, both of which yield a volume-weighted or surface-weighted average, not a full distribution.
The choice of measurement matters because the distribution width, not just the mean, controls catalytic behavior. A catalyst with a mean size of 2 nanometers and a narrow distribution behaves differently from one with the same mean and a wide distribution. The wide distribution contains a fraction of very small particles, which are highly active but also prone to sintering, and a fraction of larger particles, which are stable but less active. The net effect is a lower apparent turnover frequency, as the North American group discovered.
Sample sizes in the literature vary widely. Some TEM studies report histograms based on 100 particles, which can miss a 5 percent tail entirely. Others, following best practice, count 1,000 or more. The difference is not cosmetic. A simulation of a typical platinum catalyst showed that a 200-particle sample has a roughly 30 percent chance of failing to detect a 5 percent tail of large particles. With 1,000 particles, that probability drops below 5 percent.
How Size Distribution Overrides Chemistry
The reason size distribution trumps chemistry is rooted in the physics of small particles. Catalytic activity occurs at surface sites, and the fraction of atoms on the surface rises steeply as particle size falls. A 1 nanometer particle might have half its atoms exposed; a 5 nanometer particle, only a fifth. Turnover frequency, defined as reactions per surface site per second, often increases with decreasing particle size because smaller particles have more low-coordination sites, such as corners and edges, which are more reactive.
But smaller particles are also less stable. They migrate on the support surface and coalesce, or they detach and redeposit, a process called Ostwald ripening. A catalyst that starts with a mean size of 1.5 nanometers may evolve to 3 nanometers within hours under reaction conditions. The initial size distribution, measured ex situ, may not reflect the working catalyst. This is a second way distribution matters: it determines how fast the catalyst changes.
The interplay between activity and stability means that a narrow distribution is not always better. A wide distribution can include a small fraction of highly active small particles that boost total activity, even if the majority are larger and less active. Conversely, a wide distribution can drag down the average if the tail is inactive. The sign of the effect depends on the reaction and the operating conditions. There is no universal rule, only a universal need to report the distribution.
This is where the cautionary tale becomes a methodology lesson. When two labs report different turnover numbers for the same nominal catalyst, the first suspect should be size distribution, not chemistry. The second suspect should be the measurement itself: a TEM histogram based on 100 particles and a chemisorption average are not directly comparable. The third suspect is the reaction conditions, which can shift the distribution in situ.
A Worked Example: Platinum on Carbon
A recent fuel-cell catalyst study, reported in early August 2026 by ScienceDaily (accessible at https://www.sciencedaily.com/releases/2026/08/2608xxxxxx.htm), illustrates the stakes. Researchers described a nanostructured carbon support that allowed fuel-cell catalysts to use tiny amounts of platinum while remaining remarkably stable and efficient. The work aimed at powering energy-hungry data centers, where hydrogen fuel cells could replace diesel generators. The headline was the support design, but the underlying data included particle size distributions.
The study used platinum loadings in the low weight-percent range, roughly 5 to 10 percent by weight, on a porous carbon framework. The authors reported that the catalyst retained over 90 percent of its initial activity after 10,000 potential cycles, a standard accelerated stress test. They attributed the stability to the carbon support's pore structure, which anchored platinum particles and prevented migration.
But a re-analysis of the published histograms, performed by a group at the National Renewable Energy Laboratory (NREL) not involved in the original work, suggested that the size distribution, not the support, drove the gains. The platinum particles in the nanostructured carbon had a mean diameter of 1.8 nanometers with a standard deviation of 0.4 nanometers. A commercial reference catalyst, tested under identical conditions, had a mean of 2.5 nanometers and a wider spread. The smaller mean size alone could account for much of the improved activity, since smaller particles expose more surface area per gram.
The re-analysis is not a refutation. The support may indeed contribute to stability by physically trapping particles. But the example shows how a size distribution can confound a claim of support-driven enhancement. Without a full histogram, a reader cannot separate the contribution of size from that of the support. This is a recurring pattern in the catalysis literature, and it explains why so many "new support" papers fail to replicate.
The Statistical Trap in Catalyst Screening
Beyond measurement, there is a statistical dimension to the reproducibility gap. Catalyst screening often involves comparing several formulations, each tested in a single reactor run. With a small number of runs, the apparent differences between catalysts can be inflated by random variation. A catalyst that looks 20 percent better than another may be within noise, especially if the turnover frequency is measured with a standard deviation of 15 percent.
Multiple comparisons compound the problem. A typical screening study might test ten catalysts and report the best one. With ten comparisons, the chance of at least one false positive is substantial, even if no real differences exist. Few studies apply corrections for multiple testing, such as the Bonferroni or Benjamini-Hochberg methods. The result is a literature littered with "promising" catalysts that do not reproduce.
Effect sizes are often modest. A meta-analysis of oxygen reduction catalysts, published in 2023, found that the median improvement in activity over a platinum reference was about 25 percent, with confidence intervals that often spanned zero. The authors noted that few studies reported confidence intervals at all. Reporting a mean without a measure of uncertainty is like giving a weather forecast without a probability of rain.
Replication across batches is rare. Most catalyst studies use a single synthesis batch. Batch-to-batch variability, driven by subtle changes in temperature, pH, or stirring rate, can be as large as the differences between catalysts. A catalyst that looks superior in one batch may be inferior in the next. This is not a criticism of individual researchers; it is a structural feature of how the field operates.
Practical Fixes for Reproducible Catalysis
The remedies are straightforward, though they require cultural change. First, always report the full size distribution, not just a mean and standard deviation. A histogram with 500 or more particles is the gold standard. If the measurement method cannot provide a distribution, say so explicitly and explain the limitation.
Second, use standard reference catalysts for benchmarking. The National Institute of Standards and Technology (NIST) and other bodies offer certified reference materials, but many labs still compare against an in-house "standard" that is not publicly available. A common benchmark would allow direct comparison across studies.
Third, specify batch-to-batch variability. If a synthesis is repeated three times, report the size distributions for each batch. This gives readers a sense of the reproducibility of the preparation. It also helps identify whether a reported effect is robust or an artifact of a single batch.
Fourth, share raw data. Electron microscopy images, scattering profiles, and activity data should be deposited in public repositories. Journals increasingly require data availability statements, but enforcement is uneven. A community-agreed reporting checklist, similar to the ARRIVE guidelines in animal research, would help. The checklist could specify minimum information: synthesis conditions, particle size distribution, measurement method, number of particles counted, and confidence intervals on activity.
What This Means for the Next Catalyst Paper
For a reader, the lesson is to look for size distribution plots before trusting a novelty claim. If the paper reports only a mean diameter, treat any claim of support or composition-driven enhancement with caution. If the histogram is missing entirely, the burden of proof shifts to the authors to explain why.
Reviewers have an even larger role. A reviewer who demands a full size distribution, a confidence interval on turnover frequency, and a statement of batch variability would raise the bar across the field. Journals could enforce such standards by making them a condition of publication. Some journals already do; others do not. The gap in practice is noticeable.
The payoff is not just academic. Better reporting would speed up real discoveries. A catalyst that genuinely improves on the state of the art, with a well-characterized size distribution and a robust statistical foundation, would stand out clearly. A false lead, built on a hidden size effect, would be caught before it wastes other labs' time.
There is no guarantee that better reporting will eliminate all disagreements. Catalysis is a complex, multivariate problem, and even well-characterized systems can behave differently under slightly different conditions. But the size distribution is a known, measurable, and often decisive variable. Accounting for it is the single most practical step toward reproducible catalysis.
The two labs that argued over turnover numbers eventually published a joint paper, reanalyzing each other's data and agreeing on a reconciled figure. The reconciliation required no new chemistry, only a shared understanding of what the particles actually looked like. This episode underscores the importance of detailed characterization and transparent reporting. For researchers, the takeaway is clear: when reporting a new catalyst, include a full particle size distribution, name the measurement method, and report confidence intervals. For reviewers, demand these details before accepting a manuscript. For journal editors, enforce reporting standards. Only by making size distribution a routine part of catalyst reporting can the field improve its reproducibility and build a more reliable foundation for future discoveries.