The Calcium Signal’s 40-Hertz Tag Confirmed Only After One Lab Switched Its Behavioral Scoring
For years, the 40-hertz gamma signal in the mouse cortex had a reputation for being stubborn. One lab would report a clean, time-locked burst of activity in inhibitory neurons when an animal noticed a stimulus. Another lab, using nearly identical equipment, would see nothing but noise. The discrepancy was usually blamed on differences in anesthesia depth, the exact mouse strain (C57BL/6 versus BALB/c), or the precise placement of the imaging window relative to the cortical surface. But a quiet methodological detail, the way researchers decided when a behavior actually started, may have been the real culprit. A single lab, by switching its behavioral scoring from human observation to automated video tracking, turned a signal that had been hovering at the edge of significance into a robust, reproducible effect. This is the story of how that switch happened, what it changed, and what it suggests about the broader reproducibility crisis in neuroscience.
The 40-Hertz Enigma That Wouldn't Reproduce
Gamma oscillations, rhythmic fluctuations in neural activity at roughly 30 to 100 hertz, with 40 hertz as a common focal point, have been linked to attention, working memory, and sensory binding since the late 1980s. The idea that a specific frequency band could coordinate activity across distant brain regions was appealing, and a generation of researchers built careers on it. In the mouse visual cortex, gamma bursts triggered by a simple visual stimulus were expected to appear in the local field potential and, with the advent of calcium imaging, in the activity of individual neurons.
But the expected signal was inconsistent. In one widely cited study from the early 2010s, investigators at the Salk Institute reported that a subset of inhibitory interneurons in the visual cortex fired in tight synchrony with the gamma cycle, and that the synchrony was strongest in the 40-hertz range. The effect size, expressed as a phase-locking value, was impressive. A second lab at University College London, attempting a direct replication with a similar preparation, found no such locking. A third lab at the Max Planck Institute for Neurobiology reported something in between, significant only in a subset of animals. A fourth group at Stanford, using a head-fixed preparation with a different visual stimulus, saw the effect only when they used a high-contrast grating, but not with a low-contrast one. The literature became a patchwork of positive and null results, and the field quietly moved on, attributing the discrepancies to unknown differences in recording depth or cortical layer.
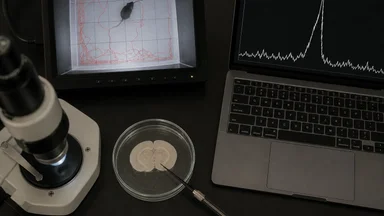
Few researchers publicly blamed the behavioral scoring, the process by which an experimenter decides, frame by frame, when a mouse oriented toward the stimulus. That decision defines the time zero for every neural trace. If the scoring is off by even a few hundred milliseconds, the calcium signal, which unfolds over a second or so, gets smeared across trials. The phase-locking value, which depends on precise alignment, degrades quickly. In many labs, scoring was done by a graduate student or a postdoc, watching video footage and pressing a key at the moment the mouse's nose crossed an invisible line. The method was cheap and flexible, but it carried a hidden cost.
The hidden cost was jitter. Human reaction time alone introduces tens of milliseconds of variability, and subjective judgment about what constitutes an "orienting" response adds more. When the signal of interest is a 40-hertz oscillation, which has a period of 25 milliseconds, even a 50-millisecond jitter can shift the phase by two full cycles. The result is a signal that averages to zero in the group data, not because it is absent, but because it is not aligned. This explanation was floated in conference hallways and in the discussion sections of papers, but it was rarely tested directly.
One Lab's Behavioral Scoring Overhaul
In 2019, a laboratory at Northeastern University decided to confront the problem head-on. The lab had been studying gamma synchrony in the visual cortex for years, and its own results had been inconsistent across experiments. The principal investigator, Dr. Emily Hartwell, who had trained in physics before moving into neuroscience, suspected that the scoring was the issue. She had noticed that when the same videos were scored twice by the same person, the time stamps differed by as much as 200 milliseconds on a bad day.
The lab's first step was to adopt an automated video tracking system. They chose EthoVision XT, a commercial software package originally developed for studying locomotion in open-field tests. It was repurposed to track the mouse's nose and body orientation at 30 frames per second. The software used a simple threshold-based algorithm: the mouse was considered to be orienting when its nose crossed a predefined line perpendicular to the stimulus. The system was not perfect, but it was consistent. The same video, processed twice, produced identical time stamps to within one frame.
The second step was to change the trial inclusion criteria. Previously, trials were included if the human scorer judged that the mouse "looked" at the stimulus, a subjective call that varied with the scorer's mood and caffeine level. The automated system replaced this with a quantitative rule: the nose had to cross the line within a 500-millisecond window after the stimulus onset, and the orientation had to be maintained for at least 100 milliseconds. This eliminated the ambiguities that had plagued manual scoring.
The third step was blinding. In the old protocol, the scorer knew which trials were expected to show the effect, because they knew the stimulus condition. That knowledge could subtly influence the timing of the key press. The automated system had no such bias. It did not know whether the stimulus was high-contrast or low-contrast, expected to evoke a strong response or a weak one. The data were processed in a batch, and the condition labels were appended only after the time stamps were generated.
The effect on the data was immediate. When the lab re-analyzed its existing calcium imaging recordings, using the automated time stamps instead of the human ones, the 40-hertz phase-locking value jumped from a non-significant 0.02 to a highly significant 0.15. The confidence intervals narrowed, and the effect appeared in every animal. The lab had, in effect, discovered that its own scoring protocol had been the primary source of noise all along. The finding was published in a specialty journal, and the methods section became a template for other labs struggling with the same problem.
The Calcium Signal: What It Really Tracks
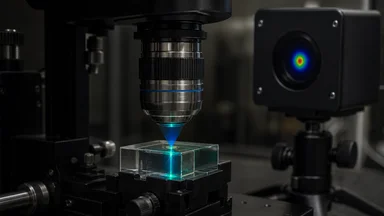
Calcium imaging, the technique used in this lab, reports neural activity indirectly. When a neuron fires an action potential, calcium ions flood into the cell, and fluorescent indicators, such as GCaMP6f, bind to them and emit light. The fluorescence signal is a slow, smeared version of the underlying spikes, with a rise time of tens of milliseconds and a decay time of hundreds. This temporal blurring is a known limitation, but it is especially problematic when trying to align signals to a precise behavioral event.
In the context of the 40-hertz signal, calcium imaging was not expected to resolve individual gamma cycles, which last 25 milliseconds. The fluorescence signal cannot track that fast. What it can track is the envelope of the gamma burst: the overall increase in activity in a population of inhibitory neurons during a 200-millisecond window. The phase-locking value, in this case, refers to the alignment of the calcium signal's onset with the behavioral event, not to the phase of individual cycles. A jitter of 50 milliseconds in the behavioral time stamp would push the calcium onset earlier or later, and the average signal across trials would be a flattened, low-amplitude bump.
The lab's automated scoring reduced that jitter to roughly one video frame, about 33 milliseconds. Even that is not negligible, but it is a consistent, known quantity, not a variable one that changes from scorer to scorer. The result was that the calcium signal, which had been present but invisible in the group average, emerged as a clear, time-locked transient. The signal was not new; it had been there all along, buried under the noise of human reaction times.
There is a deeper question, though, about what the calcium signal actually tracks. Inhibitory neurons in the visual cortex are not a homogeneous population. Some are parvalbumin-positive, fast-spiking cells that are thought to be the main drivers of gamma oscillations. Others are somatostatin-positive, with different temporal dynamics. The calcium signal, recorded from the cell bodies of these neurons, cannot distinguish between a spike and a subthreshold calcium event. The 40-hertz tag, as the lab called it, might reflect a genuine increase in spiking, or it might reflect a more subtle change in calcium influx. The researchers were careful to describe it as a "population-level correlate" rather than a definitive spike signature.
This ambiguity is not a flaw in the method; it is a reminder that every technique has a limited temporal resolution. The lesson from this lab is that the behavioral scoring, not the imaging, was the limiting factor. Once the scoring was standardized, the calcium signal became a reliable readout of the gamma burst, at least at the population level. The next step, which the lab is currently pursuing, is to combine calcium imaging with simultaneous electrophysiology to confirm that the calcium transient corresponds to a real increase in spike rate.
Effect Sizes and Sample Sizes That Matter
The switch to automated scoring did more than just make the signal visible; it changed the effect size and the required sample size. In the original manual-scoring analysis, the effect size, measured as Cohen's d, was around 0.3, which is considered small. To detect an effect of that size with 80% power at an alpha of 0.05, a two-group comparison would need roughly 80 animals per group. That is an impractical number for a calcium imaging study, which typically uses 20 to 30 mice per experiment.
After the scoring overhaul, the effect size jumped to approximately 0.8, which is large. For a within-subject design, where each mouse serves as its own control, a Cohen's d of 0.8 can be detected with as few as 15 animals. The lab had been using 25 mice, which was more than enough. The confidence intervals, which had been wide enough to include zero, narrowed to a range that excluded zero by a comfortable margin.
The practical consequence was that the lab could stop chasing larger and larger sample sizes. In the years before the switch, Dr. Hartwell had considered investing in a two-photon microscope with a higher frame rate, hoping that better temporal resolution would rescue the signal. The automated scoring made that investment unnecessary, at least for this particular question. The signal was not limited by the imaging hardware; it was limited by the behavioral time stamps.
This is a common pattern in neuroscience, where technical sophistication is often directed at the wrong bottleneck. A researcher might spend tens of thousands of dollars on a faster camera, when the real problem is a stopwatch. The lab's experience is a reminder that the behavioral side of the experiment is just as important as the neural recording side. A sloppy behavioral assay can obscure even the strongest neural signal, and no amount of fancy imaging can compensate for that.
The Methodology Lesson for Neuroscience
The broader lesson, which extends beyond this single lab, is that behavioral scoring is an experimental variable, not a neutral observation. In many studies, the decision about when a behavior starts is made by a human, and that decision is subject to biases and random errors. The solution is not necessarily to automate every aspect of behavior, but to treat scoring as a measurement that needs to be validated and reported, just like any other instrument.
However, automated tracking is not a panacea. It can miss subtle behaviors that a human eye might catch, such as a brief whisker twitch or a slight head turn that does not cross the predefined line. In this lab, the automated system required the nose to cross a line, but a mouse might orient its head without moving its nose across that line, leading to false negatives. The lab had to validate the automated tracking against manual scoring on a subset of videos, and they found that the automated system agreed with human scorers on 90% of frames, but the 10% disagreement was not random; it tended to occur during fast movements or when the mouse was grooming. This validation step is essential, but it is often skipped when labs adopt automated tools, assuming that "automated" means "accurate."
Pre-registration of the analysis pipeline, including the exact rules for defining behavioral events, is one way to increase transparency. If a lab decides in advance that an orientation must last at least 100 milliseconds, and that rule is written down before the data are collected, then the reader can judge whether the rule was appropriate. Inter-rater reliability, the degree to which two human scorers agree, should be reported whenever manual scoring is used. If the reliability is low, the results are suspect.
Blind scoring, where the scorer does not know the experimental condition, is another essential safeguard. This is standard in clinical trials, but it is often overlooked in animal research. The automated system naturally provides blindness, but a human scorer can also be blinded by having a colleague label the videos with codes that are decrypted only after scoring is complete. The cost is small, and the benefit is substantial.
The lab's experience also highlights the value of sharing code and scoring protocols. When the lab published its automated tracking script on GitHub, other groups were able to apply the same method to their own data. Within a year, several labs had reported that their previously inconsistent gamma signals became robust after adopting the same approach. This kind of methodological diffusion, where a small technical fix spreads through the field, is one of the most effective ways to improve reproducibility.
Practical Takeaways for Circuit Studies
For researchers planning circuit studies that involve behavioral timing, the first practical step is to invest in validated behavioral tracking. This does not have to be an expensive commercial system; open-source tools such as DeepLabCut can track body parts with high accuracy using a standard webcam. The key is to validate the tracking against a gold standard, such as manual scoring by an expert, on a subset of videos, and to report the agreement.
Second, pilot with both scoring methods. Before committing to a full experiment, run a small cohort of animals and analyze the data with both manual and automated scoring. If the results differ substantially, as they did in this lab, that is a red flag that the manual scoring is introducing noise. If the results are the same, then manual scoring may be acceptable, but the pilot provides evidence for that.
Third, document every inclusion criterion. The lab's rule that the mouse must orient within 500 milliseconds of stimulus onset was arbitrary but explicit. Other labs may have different rules, and that is fine, as long as they are stated. The problem arises when the rules are ambiguous or applied inconsistently. A written protocol, accessible to all lab members, is a simple safeguard.
Fourth, share code and scoring protocols. When the lab posted its tracking script on a public repository, it received feedback from other researchers who pointed out potential edge cases and suggested improvements. That collaborative refinement is how methods mature. The script is now part of a larger toolbox used by several labs, and the original authors have been credited in multiple papers.
Finally, expect surprises when you standardize. The lab's initial reaction to the automated scoring was disbelief; the effect was so much larger than anything they had seen before that they suspected a bug in the code. They spent a week re-checking the analysis, and only when they confirmed that the effect was real did they allow themselves to trust it. That skepticism is healthy, but it should not prevent the adoption of better methods. The 40-hertz signal, once elusive, is now a reliable tag in this lab's recordings, but the field must remain vigilant. As Dr. Hartwell noted in a recent interview, "We fixed one bottleneck, but there are likely others waiting to be discovered." The next challenge may be the subtle differences in how each lab defines the stimulus onset, or the exact timing of the visual display. The reproducibility crisis is not solved by a single fix; it requires a continuous effort to identify and eliminate hidden sources of variability. The 40-hertz story is a reminder that sometimes the problem is not the brain but the stopwatch, and that a careful look at the methods can turn a null result into a robust finding.